
AI and the U.S. Workforce: What the Data Shows in Five Key States
Every board in the country is asking some version of the same question: how much of our workforce is exposed to AI? The macro research answers it at the level of the economy. McKinsey, Goldman Sachs, the Federal Reserve banks, and a growing academic literature all publish credible estimates of what share of work is affected. None of them tell an HR director which of their forty-two roles are at risk, at what intensity, or what to do about it.
State-level data gets you closer. Not because states regulate AI differently in any way that shows up in employment yet, but because states differ enormously in what people there do for a living. Exposure follows occupation mix, and occupation mix follows industry mix. A state heavy in back-office finance carries a different exposure profile than one heavy in construction and logistics, and the gap between them is larger than anything policy has produced.
Below is what the employment data shows across five of the largest state labor markets — California, Texas, New York, Florida, and Illinois — and how to translate a state-level read into a company-level plan.
What "AI exposure" actually measures
Exposure is not a prediction that a job disappears. It is a measure of how much of a job's task content overlaps with what current AI systems can do. That distinction matters, and most coverage collapses it.
The methodology that has held up best works from the U.S. Department of Labor's O*NET database, which decomposes roughly 900 occupations into their constituent work activities and tasks, each rated for importance within the role. Researchers score those tasks against AI capability, then aggregate back up to an occupation-level number. Felten, Raj, and Seamans built the widely cited version of this — occupational, industry, and geographic exposure indices derived from the same taxonomy.
A useful sense of scale: a Federal Reserve Bank of Philadelphia study of its district found median AI exposure across occupations at roughly .307 — about 31 percent of a typical occupation's tasks are affected — and exposure over three times higher for occupations that generally require a bachelor's degree (.449) than for those that don't (.140). That inversion is the single most important thing to understand about this wave. Previous automation pressed hardest on routine manual work. This one presses hardest on credentialed desk work.
Two cautions before reading anything into a single number.
Exposure runs in both directions. Christos Makridis of Arizona State University and Andrew Johnston of the University of Texas at Austin, working from administrative data covering more than 95 percent of U.S. employers between 2017 and 2024, find that a one standard deviation increase in AI exposure raised sector output by roughly 10 percent by 2024, with employment up 3.9 percent and the total wage bill up 4.8 percent. Their conclusion is that AI is not destroying jobs in aggregate — but that workers captured only about 29 cents of every dollar of the resulting growth, with the rest accruing to capital. They also find the employment gains concentrated in states where workers can move freely between firms and occupations, and effectively absent where labor markets are rigid.
And no single index is reliable on its own. Research published in PNAS Nexus found that individual AI exposure models were not predictive of occupations' unemployment risk, job separations, or skill change, while an ensemble combining several approaches was. Treat any one score as an input, not a verdict.
Why the state you operate in matters
Here is the useful frame: a state's exposure is a weighted average of its occupations, and its occupations are set by its industries. Three sectors carry disproportionate exposure — information, financial activities, and professional and business services — because they concentrate the cognitive-routine work that current systems handle well: document drafting, reconciliation, first-pass analysis, structured research, routine client correspondence. Education and health services, construction, and leisure and hospitality carry much less, because their work is physical, interpersonal, or both.
So the question "how exposed is my state?" reduces to "how much of my state's payroll sits in those three sectors?" And a second question worth asking alongside it: what are those sectors actually doing right now?
One caveat before the numbers. State payroll counts follow the establishment, not the worker. In exactly the knowledge-intensive sectors carrying the most exposure, those two have come apart: a Chicago bank's remote analyst living in Indiana is likely counted in Illinois payroll, and a distributed software team may sit in a dozen states while reporting to one. That adds a layer of variance to every state figure below — and it cuts in the same direction as the rest of this article. The state tells you less about your own workforce than you would like.
Nonfarm employment and twelve-month change, May 2026
State | Total nonfarm | Information | Financial activities | Professional & business services | Education & health services |
|---|---|---|---|---|---|
California | 18.15M (+0.5%) | 514.2K (−3.2%) | 786.1K (−1.1%) | 2.75M (−0.3%) | 3.60M (+4.1%) |
Texas | 14.43M (+0.7%) | 214.3K (−4.1%) | 941.1K (−0.1%) | 2.17M (+1.9%) | 2.01M (+1.4%) |
New York | 9.99M (+0.4%) | 270.6K (−0.1%) | 762.2K (+0.8%) | 1.41M (+1.0%) | 2.44M (+1.4%) |
Florida | 10.02M (+0.1%) | 149.5K (−2.3%) | 677.5K (−2.1%) | 1.64M (+1.0%) | 1.62M (+1.9%) |
Illinois | 6.16M (0.0%) | 89.7K (−0.7%) | 381.9K (−3.0%) | 896.4K (−2.0%) | 1.04M (+1.8%) |
Source: U.S. Bureau of Labor Statistics, State Employment and Unemployment, May 2026, seasonally adjusted. Illinois figures are preliminary.
Two reading caveats. Percentage changes on smaller sectors move a lot of ground for very few jobs — New York's −0.1 percent in information is about 270 jobs and Texas's −0.1 percent in financial activities about 940, both well inside normal revision range. Read those as flat rather than as declines. And employment change reflects interest rates, federal spending, and post-pandemic normalization alongside anything AI is doing; none of this is causal evidence.
With that said, the pattern is hard to miss. Information is negative or flat in all five states. Education and health services — the lowest-exposure large sector — grows in all five. That is the shape you would expect if exposure were beginning to bite, and it is worth watching.
California
Information −3.2% · Financial −1.1% · Professional & business −0.3% · Education & health +4.1%
California's information sector — 514,200 jobs in May 2026, down 3.2 percent over twelve months — is both the state's signature industry and its most exposed one. Financial activities fell 1.1 percent and professional and business services was flat at −0.3 percent, while education and health services grew 4.1 percent and carried more than all of the state's modest overall gain.
For an HR team in California, the exposure conversation is rarely about the engineers. It is about the layer around them: technical writers, content and marketing operations, program coordinators, financial analysts, and the research and QA functions that support product organizations. These roles score high on cognitive-routine work and tend to be invisible in headcount planning because they sit across departments rather than in one.
If your organization is in professional or technical services, the Professional Services AI Exposure Pack provides a NAICS 5416 role set already mapped to O*NET occupations with a scoring workbook, which removes the slowest part of a first assessment.
Texas
Information −4.1% · Financial −0.1% · Professional & business +1.9% · Education & health +1.4%
Texas shows the sharpest information-sector contraction of the five — 214,300 jobs in May 2026, down 4.1 percent year over year — alongside something none of the other four states matches: professional and business services growing 1.9 percent, the fastest expansion in that sector across this group.
That combination is the most interesting data point in the table. Texas is absorbing corporate relocations and shared-services consolidation into Dallas–Fort Worth, Houston, and Austin at the same time that its media and telecom employment declines. Exposure and growth are running simultaneously in the same state, which is exactly why a state-level average would mislead you here. The back-office, finance, and administrative functions moving into Texas are high-exposure by task content even as they are net job creators by headcount. An employer measuring its own risk from the state's growth number would reach the wrong conclusion in either direction.
New York
Information −0.1% · Financial +0.8% · Professional & business +1.0% · Education & health +1.4%
New York is the counterexample, and a necessary one. It has the largest concentration of financial activities employment in this group relative to its size — 762,200 jobs in May 2026, up 0.8 percent — with professional and business services up 1.0 percent and information essentially flat. Every one of the three high-exposure sectors is holding or growing, in the same months those sectors contracted elsewhere.
This is the clearest available evidence that exposure is not destiny. New York's finance, legal, and media employers have among the highest task-level exposure in the country, and they are hiring. What is changing is the composition of the work inside those roles, not the count of the roles — which is precisely the change that shows up in job architecture, compensation banding, and skills requirements long before it shows up in headcount.
For financial services organizations, the Financial Services AI Exposure Pack covers a NAICS 5221 role set with scoring weighted toward cognitive-routine and judgment work, which is where the real variance in that sector sits.
Florida
Information −2.3% · Financial −2.1% · Professional & business +1.0% · Education & health +1.9%
Florida's distinguishing figure is financial activities: 677,500 jobs in May 2026, down 2.1 percent year over year, with information off 2.3 percent, against education and health services up 1.9 percent.
Florida's financial employment skews toward insurance carriers, claims operations, title and mortgage servicing, and customer administration — work that is dense in structured document handling and rule-based decisioning, and correspondingly exposed. The state's large healthcare footprint adds a second concentration: healthcare administration, where billing, coding, prior authorization, and scheduling roles carry meaningfully higher exposure than clinical roles in the same organization.
That split inside a single employer is common and easy to miss. The Healthcare Administration AI Exposure Pack is built for exactly that case, with rubric presets tuned to administrative cognitive-routine and social/judgment work.
Illinois
Information −0.7% · Financial −3.0% · Professional & business −2.0% · Education & health +1.8%
Illinois has the most concentrated set of declines in the group. Financial activities fell 3.0 percent to 381,900 jobs and professional and business services fell 2.0 percent to 896,400, while total nonfarm employment was flat at 6.16 million and education and health services grew 1.8 percent.
Chicago's economy is built on precisely the functions that score highest on exposure: commercial banking and insurance operations, corporate shared services, consulting, accounting, and logistics coordination. A flat headline number concealing a 3.0 percent decline in the state's most exposed large sector is the pattern most likely to catch a workforce planner by surprise, because aggregate stability makes the case for doing nothing. Illinois is the state in this group where a board would be most justified in asking for a role-level view rather than a summary.
Three patterns that hold across all five
Exposure is a white-collar phenomenon this time. The Philadelphia Fed's finding that degree-requiring occupations carry roughly three times the exposure of non-degree occupations shows up in every state above. The sectors under pressure are the ones with the highest average wages.
Aggregate employment hides the movement. Illinois was flat overall while its two most exposed sectors fell. Texas grew while its information sector fell 4.1 percent. Anyone reading only the headline number is reading the wrong number.
State averages are the wrong unit of analysis for an employer. Texas contains both the fastest-growing professional services employment and the fastest-declining information employment in this group. Two companies headquartered forty miles apart can have opposite exposure profiles. The state tells you about the labor market you hire from. It tells you nothing specific about the roles you already employ.
Translating this into a plan
If you run people strategy at a mid-sized organization, five steps get you from macro anxiety to a defensible position:
Inventory roles, not headcount. Export your role list from your HRIS. You need distinct role types — typically ten to a hundred for an organization of 200 to 5,000 employees — not a list of every employee.
Map each role to an O*NET occupation. This is the step that makes the analysis auditable. When a board member asks why a role scored where it did, the answer traces back to a published federal task inventory rather than to someone's judgment.
Score at the task level, across dimensions. A single composite number is not defensible. Separating cognitive-routine, physical-routine, social/judgment, and creative content lets you explain why two roles with the same headline score need different responses.
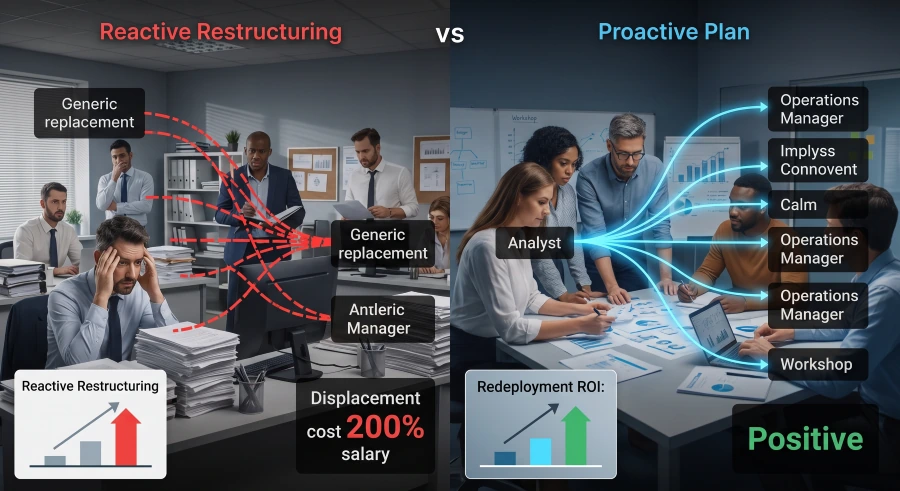
Identify adjacency before you identify risk. For every role that scores High or Critical, find the occupations with the largest skill overlap. This is where the Makridis and Johnston finding bites: their employment gains showed up where workers could move between roles and firms, and vanished where they couldn't. Internal mobility is the mechanism, and it has to be built before it is needed. Redeployment planning done in advance costs a fraction of reactive restructuring — SHRM puts replacement cost at 50 to 200 percent of annual salary per displaced employee.
Re-run it on a schedule. Exposure is a moving target. A one-time consulting report is stale the quarter after it lands. Whatever method you choose needs to be repeatable by your own team.
Where to start
Rovaryn Digital built WorkforceAnalysis.com to make that five-step workflow something an HR team can run themselves. The AI Exposure Analyzer maps your roles to O*NET occupations, scores every task against a transparent four-dimension rubric weighted by O*NET task importance, surfaces department heatmaps with role-level drill-down, and recommends adjacent occupations with skill-overlap percentages for every High or Critical role. The output is a board-ready PDF or PPTX. You can see the full feature set or estimate what your current approach is costing you before committing to anything.
If you would rather run the first pass manually — which is a reasonable way to learn the method before buying software — the WorkforceAnalysis.com store carries the same methodology as templates:
AI Exposure Scorecard ($29) — an Excel workbook with the O*NET task-mapping guide and manual scoring rubric. The place to start.
Role Redeployment Planning Workbook ($49) — maps High and Critical roles to adjacent occupations with skill-overlap estimation.
Workforce AI Readiness Assessment Guide ($79) — the full method, written for the people-analytics lead who has to defend it.
HR AI Strategy Toolkit ($99) — nine tabs covering assessment, scenario comparison, redeployment ROI, and a board deck outline.
Workforce AI Readiness Complete Kit ($299) — every tool above in one bundle, plus bonus checklists.
More on methodology, board reporting, and workforce planning is on the WorkforceAnalysis.com blog. Product details for the platform itself are on the WorkforceAnalysis.com product page.
Frequently asked questions
Which US states have the highest AI job exposure?
Exposure tracks industry mix rather than state borders. States with large shares of employment in information, financial activities, and professional and business services — California, New York, Illinois, and Massachusetts among them — carry higher average exposure than states weighted toward construction, agriculture, or leisure and hospitality. But within-state variation between employers is larger than the variation between states.
Does high AI exposure mean job losses?
No. Exposure measures task overlap with AI capability, not displacement. New York's most exposed sectors held or grew over the past year. Research using administrative data on more than 95 percent of U.S. employers finds that more exposed sectors gained output, employment, and wages — while workers captured under a third of the resulting gains.
What data should a company use to assess its own AI exposure?
The O*NET database, published by the U.S. Department of Labor, is the standard foundation. It decomposes about 900 occupations into task-level detail with importance ratings, which makes a scoring exercise traceable and auditable rather than a matter of opinion.
How long does an internal AI exposure assessment take?
Done manually in a spreadsheet, expect 80 to 250 hours per cycle for a mid-market organization. A consulting engagement typically runs $20,000 to $80,000 and produces a one-time report. Purpose-built software compresses the workflow to hours and makes it repeatable.
Which roles are most exposed?
Across the research, the highest-scoring occupations are analytical and administrative desk roles: budget and financial analysts, credit and claims processing, procurement, compliance documentation, technical writing, and routine research and reporting. The lowest are skilled trades, construction, and hands-on care work.
Methodology and sources
State employment figures are from the U.S. Bureau of Labor Statistics, State Employment and Unemployment, seasonally adjusted, for May 2026 — the most recent month available for all five states on a common basis at the time of writing (California, Texas, New York, Florida, Illinois). Illinois figures are preliminary; the others reflect subsequent revision. National occupational employment is from the BLS Occupational Employment and Wage Statistics, May 2025 estimates released May 15, 2026.
Exposure methodology draws on the O*NET occupational taxonomy and on published AI exposure research, including Felten, Raj, and Seamans (2021) on occupational, industry, and geographic exposure indices; the Federal Reserve Bank of Philadelphia's district exposure study; Christos Makridis and Andrew Johnston on output, employment, and wage effects across AI-exposed industries and states; and PNAS Nexus research on the predictive limits of individual exposure models.
Exposure scores are analytical inputs, not forecasts of displacement. Sector-level employment change reflects many factors beyond AI adoption, and this article does not claim a causal relationship between the two.
Rovaryn Digital builds focused B2B software for markets too small for enterprise vendors and too important to ignore. See the full product portfolio or get in touch.