
Most executives prepare for a compensation conversation the way they'd prepare for a dinner reservation. An hour of searching, a few numbers written down, a rough sense of "the market." Then they walk into a room where the other side has spent six months on the same question with a consultant on retainer.
That asymmetry is the whole problem. It isn't that executives are careless. It's that CEO pay is one of the few subjects where the easy sources are actively misleading, the good sources are public but tedious, and almost nobody has a spare weekend to close the distance.
We built CEOSalary.com because we kept finding the same pattern. Here's what thorough research on this question actually requires.
The easy sources are the wrong sources
There are three places most people start, and each one fails for a different reason.
Self-reported aggregators. Sites built on user submissions have a selection problem at the executive level that they can't fix. The population of CEOs willing to anonymously submit their compensation package is not a random sample of CEOs, and at the top of an org chart the sample sizes get thin fast. Worse, these figures usually collapse a complex package into a single "salary" number, which is the least interesting part of executive compensation.
Paid survey data. Compensation surveys are real research, and they're also purchased by the company, scoped by the company, and delivered to the compensation committee. If you're the executive, you're reading a report commissioned by the party across the table — assuming you get to read it at all. There's nothing improper about that. It's just not your evidence.
Media coverage of CEO pay. Headline pay figures are usually pulled from the Summary Compensation Table in a proxy statement, which reports equity at grant-date fair value. That is an accounting number, not money anyone received. An executive whose stock fell 40% still appears in the headline at the full grant value. Reason from those numbers and you'll build a peer comparison out of a metric that doesn't describe anyone's actual outcome.
What thorough actually means
Real research here has four parts, worked roughly in this order. Skipping any one of them tends to be the thing that collapses under questioning.
1. The peer set is the argument
This is the single largest lever, and the one most people never touch. Change your comparison group and the median moves more than any other adjustment you can make.
A defensible peer set is built on stated criteria: revenue band, sector, geography, and ownership structure. It's roughly the same discipline a compensation committee applies when it constructs its own peer group, often with input from proxy advisors. When a board says "we benchmark against companies like us," you want to be able to say what "like us" means, in numbers, and show why your version is more honest than theirs — or agree with theirs and argue inside it.
A peer set you can't defend is worse than none at all. The first question from anyone experienced will be how did you pick these companies, and "they seemed comparable" ends the conversation.
2. The number has to mean the same thing on both sides
Executive compensation is not one figure. It's base salary, target and actual annual incentive, long-term incentive grants, the vesting and performance conditions attached to those grants, deferred compensation, retirement contributions, and perquisites. Comparing your cash base against someone else's total reported compensation isn't a comparison, it's a category error.
There's a second layer underneath. Grant-date fair value and realized pay answer different questions, and since the SEC's Pay Versus Performance disclosure rules, proxy statements give you both. Which one belongs in your case depends on what you're arguing. If you're negotiating a new grant, fair value is the relevant frame. If you're arguing that your existing package underdelivered against a peer group, realized pay is.
3. The parts that aren't salary are often worth more
Severance multiples. Change-of-control triggers, and whether they're single or double. Equity acceleration on termination. Non-competes and restrictive covenants. Clawback provisions. Definitions of "cause" and "good reason" — which sound like boilerplate until the day they decide whether you leave with a package or without one.
These terms are disclosed. Public companies describe termination and change-of-control arrangements in their proxies, and merger proxies include quantified golden parachute disclosure. A change-of-control provision negotiated at signing is a one-time swing that can exceed several years of salary difference, and it's negotiated at the moment you have the most leverage you will ever have.
Research that only covers cash compensation misses the most valuable clause in the contract.
4. Every figure needs to trace back to a filing
The purpose of doing the work isn't to know the number. It's to be able to show your work when someone pushes.
A figure with a citation to a specific filing is evidence. The same figure without one is an assertion, and assertions get discounted in rooms full of people who deal in documents. This is also why recency matters: proxy statements are filed ahead of the annual meeting and report the last completed fiscal year, so even current filings describe pay decisions made twelve to eighteen months ago. Knowing that lag is part of using the data honestly, and part of not being caught out by it.
The data is public. That's the point.
Everything above sits in filings anyone can read.
SEC Form DEF 14A, the annual proxy statement. Summary Compensation Table, Compensation Discussion and Analysis, grant and vesting detail, pay ratio, pay versus performance, and the narrative on termination and change-of-control arrangements. Filed to EDGAR, free to read.
SEC XBRL financial data. The structured financials behind peer screening — revenue bands, sector classification, and the size comparisons that make a peer set defensible.
IRS Form 990, Part VII and Schedule J. Officer compensation at nonprofits and many large institutions: base, bonus, deferred amounts and benefits, disclosed annually.
There's no gate on any of it. The barrier is volume. A serious peer set is fifteen to thirty organizations. Each proxy statement runs eighty to a hundred and fifty pages, with the compensation tables in different places, under different headings, using different fiscal years and slightly different definitions. Doing that by hand is a weekend if you already know exactly what you're looking for, and considerably longer if you don't — repeated every year, because the filings refresh annually and your peer set drifts.
That's the actual reason most executives negotiate on a guess. Not indifference. Arithmetic.
What the gap costs
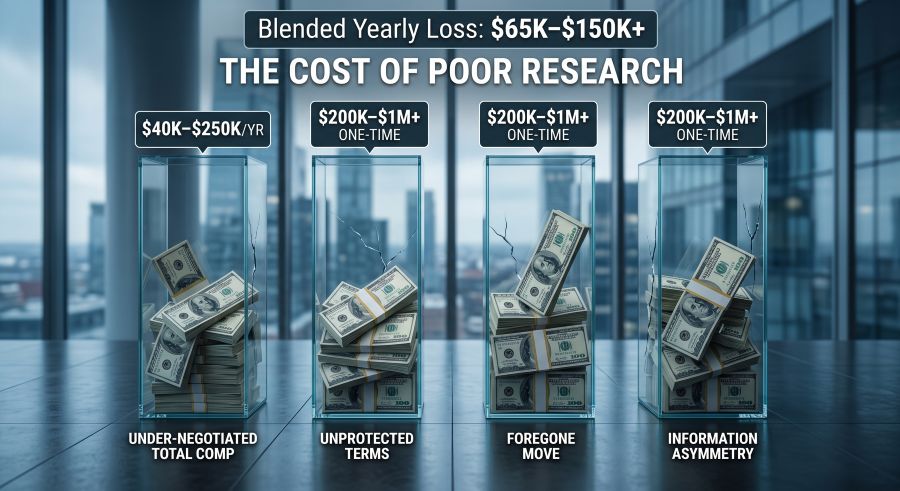
Our modelling puts the cost of walking in without a defensible benchmark at roughly $65,000 to $150,000 a year, blended.
Where it leaks | Estimated cost |
|---|---|
Under-negotiated total comp at offer or renewal | $40,000–$250,000/yr |
Unprotected severance and change-of-control terms | $200,000–$1,000,000+ one-time |
A foregone move to a better-compensated role | $50,000–$300,000/yr |
Board and comp-committee information asymmetry | $25,000–$100,000/yr |
Blended annual cost | $65,000–$150,000/yr |
These are ranges, not promises, and they depend heavily on package size and where you are in the cycle. But the direction is consistent: on a $500K–$2M package, arriving with a sourced case rather than a number typically moves outcomes by 5–15% of total compensation. The research is the cheapest input in that equation by an order of magnitude.
Do the work, or use the tool
None of this requires a vendor. Every source named here is free, and an executive with a spare weekend and a tolerance for SEC formatting can assemble a credible benchmark alone. If that's you, start with EDGAR full-text search, build the peer set before you look at a single pay figure, and record the filing date next to every number you pull.
If you'd rather not spend the weekend, that's what we built. CEOSalary.com ingests SEC DEF 14A and XBRL data, cross-validates it against IRS Form 990, and lets you build a peer set by revenue band, sector, region and ownership type. It shows where you sit at the 25th, 50th, 75th and 90th percentile with a citation on every figure, and exports a negotiation case-builder PDF you can bring into the room. Plans start at $29/month on a personal card — no company expense report, no procurement, and no survey vendor sitting on both sides of the table.
Either way, the principle holds. The comp conversation happens once every few years and sets what you earn in between. It deserves more than an afternoon.
CEOSalary.com is built by Rovaryn Digital Inc. Learn more about the product or get in touch.